
What a shared reporting view should answer
A shared dashboard is useful when it reduces the work of reconciling definitions and explains what changed. Start with the decisions it should support: adjusting investment, investigating a market, resolving a conversion problem or planning the next campaign. Connecting sources alone does not make their figures comparable. Reporting needs agreed time periods, currencies, conversion definitions and ownership of corrections. The view should show when information was last refreshed and where records are incomplete.
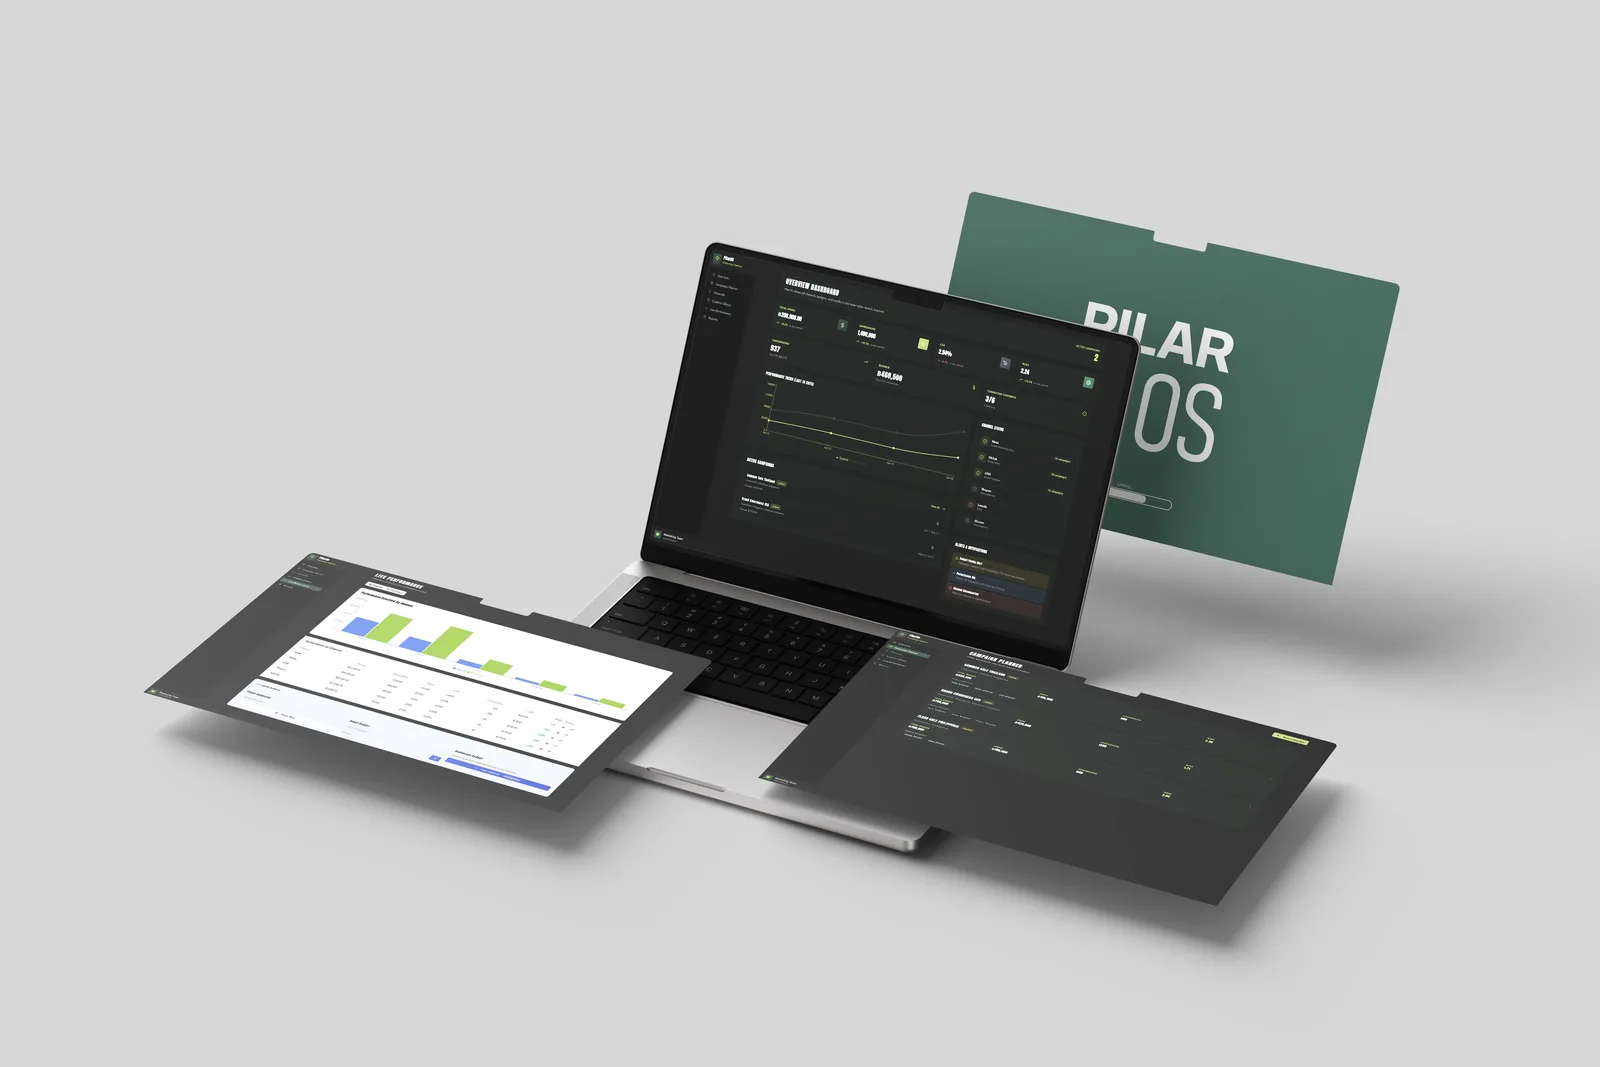
Views for different decisions
Use these points to define the requirements and responsibilities for your setup.
- Leadership view
Summarise investment, agreed outcomes and the main changes requiring a decision. Keep business results distinct from leading indicators such as visits or form responses.
- Market view
Compare local results with the relevant offer, audience, budget and operating conditions. Preserve the detail needed to explain why two markets behave differently.
- Operator view
Provide the campaign, creative or destination detail needed to investigate a problem. Make it possible to move from a summary to the underlying evidence.
Comparing lead generation across markets
Two country teams report different costs per lead. One counts every completed form; the other counts enquiries accepted by sales. A consistent report shows both stages and the definition behind each, so leadership can compare equivalent measures before reallocating budget.
Preparing the reporting scope
Identify the source systems, required views, refresh expectations and people who own each measure. Confirm which connections are available and where an export or manual input is needed. Reporting should make uncertainty visible and end with a decision or an assigned investigation.
Discuss your reporting needs
Share the business question and the systems involved. We can work through the requirements and define a suitable next step.